Distribution law
Example of the distribution law
The law of meanness is the law of distribution, but it does not yet have a mathematical model, but many other laws have a fairly clear mathematical description, for example, the normal distribution law or the Poisson distribution. Distribution, distribution function, distribution law - it's all the same, mathematical description of the probability of an event. For example, on the way to work, you sometimes go to the store to buy water, for you it's just a store, and the shopkeeper already has the law of distribution and the shopkeeper knows when you will come in and how much water to buy for a week! Here's how he did it:
| MON | TUE | WED | THU | FRI | SAT | SUN | ||
| 1 | × | ✓ | ✓ | ✓ | × | ✓ | ✓ | |
| 2 | × | × | ✓ | × | ✓ | ✓ | ✓ | |
| 3 | ✓ | × | ✓ | × | × | × | × | |
| 4 | × | × | ✓ | ✓ | × | ✓ | × | |
| 5 | ✓ | × | × | × | × | ✓ | × | |
| 6 | ✓ | × | × | × | × | ✓ | ✓ | |
| 7 | × | × | × | ✓ | × | ✓ | ✓ | |
| 8 | ✓ | × | ✓ | ✓ | × | × | ✓ | |
| 9 | ✓ | × | ✓ | × | × | × | ✓ | |
| 10 | × | ✓ | ✓ | ✓ | × | ✓ | ✓ | |
| 11 | ✓ | × | × | ✓ | × | × | × | |
| 12 | × | × | ✓ | × | ✓ | × | × | |
| 13 | × | ✓ | ✓ | × | × | ✓ | × | |
| 14 | × | × | × | ✓ | × | ✓ | ✓ | |
| 15 | ✓ | × | ✓ | ✓ | ✓ | ✓ | × | |
| 16 | ✓ | ✓ | ✓ | ✓ | ✓ | × | × | |
| 17 | ✓ | × | ✓ | × | ✓ | × | × | |
| 18 | × | × | × | ✓ | × | × | ✓ | |
| 19 | × | ✓ | × | ✓ | ✓ | ✓ | ✓ | |
| 20 | ✓ | × | ✓ | ✓ | × | × | ✓ | |
| 21 | × | × | × | ✓ | × | ✓ | ✓ | |
| 22 | × | × | ✓ | ✓ | × | × | ✓ | |
| 23 | ✓ | ✓ | × | ✓ | ✓ | × | × | |
| 24 | × | ✓ | × | × | × | ✓ | ✓ | |
| 25 | ✓ | × | ✓ | × | × | × | ✓ | |
| 26 | × | ✓ | × | ✓ | ✓ | × | ✓ | |
| 27 | ✓ | ✓ | × | ✓ | × | ✓ | × | |
| 28 | ✓ | × | ✓ | ✓ | ✓ | ✓ | × | |
| 29 | × | ✓ | ✓ | ✓ | × | ✓ | ✓ | |
| 30 | × | ✓ | × | × | × | ✓ | ✓ |
First of all, the shopkeeper compiled a table of when you bought water and when you didn't buy it, then he recorded these data in this form, what can be seen how many times a week you visited:
| number of visits | |||||||
|---|---|---|---|---|---|---|---|
| 0 | 1 | 2 | 3 | 4 | 5 | 6 | 7 |
| 0 | 0 | 5 | 12 | 6 | 7 | 0 | 0 |
| number of weeks | |||||||
So, there were 30 weeks in total and we can talk about relative numbers, that is, express the number of visits as a percentage:
Types of representation
| number of visits | |||||||
|---|---|---|---|---|---|---|---|
| 0 | 1 | 2 | 3 | 4 | 5 | 6 | 7 |
| 0% | 0% | 16.7% | 40% | 20% | 23.3% | 0% | 0% |
| weeks with so many visits | |||||||
This table is the distribution law of the number of visits per week. Also, this law can look like a beautiful graph:
It would also be possible to derive an equation that describes this distribution, and this equation would also be the distribution law.
A table, graph, and equation are ways of representing the same thing: what is the probability of event X. The shopkeeper is interested to know with what probability You will visit 0,1,2, etc. times, so event X is the number of visits per week and the distribution law gives the probability of this event.
In life
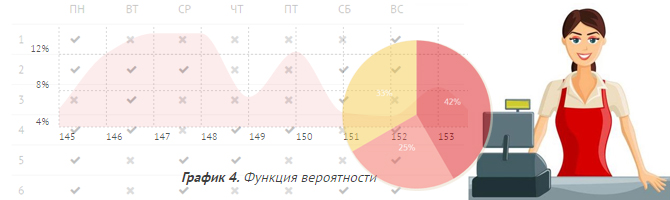
In this way, information was collected about various events in all corners of the world: how many ants live in an anthill, how fast the substance burns, the average earnings in the country, and so on. Then we began to notice that different events (an event is a fact of interest to us) have the same graphs of the distribution law, for example, considering the operation of the telephone exchange during the year, it turned out that the law of distribution of calls per minute has the following form:
Here, for example, the probability that 4 people will call within a minute is 17.55%, the probability that 2 people will call is 8.42%, the probability that 5 people or less will call is 61.6%.
Hypothesizing
And now, having a probability distribution, we can make various assumptions, for example, in the case of a telephone exchange, we can to put forward the assumption that in order to serve 87% of calls, we need to answer 7 calls per minute (the probability that 7 people or less will call is 86.6%, we rounded up). In order to serve 93% of calls, we need to answer 8 calls per minute and so on.
The shopkeeper may assume that if he buys 4 bottles of water a week, the probability that there will be no water when you need it is 23.3%, in turn, the probability that he will not sell all the water - 56.7%.
The law of distribution of a discrete quantity
The considered examples have a discrete form, i.e. the event X has certain values. It happens that a discrete distribution is not suitable, that it is necessary to talk about ranges of values, for example, if you measure the amount of water in a glass: You are not measuring the number of atoms, and the volume, while there is always an error, if you measured 99.92 ml, then it can be 99.925, or 99.922365, or 99.25552323 and so on, so so, in order not to include all these values in the table, you include only the rounded value and in the end you get a table, graph or function again:
| Distribution law | |
|---|---|
| Water volume | Probability |
| 145 ml | 14% |
| 146 ml | 11.8% |
| 147 ml | 13.2% |
| 148 ml | 3.3% |
| 149 ml | 11.6% |
| 150 ml | 4.1% |
| 151 ml | 5.1% |
| 152 ml | 7.7% |
| 153 ml | 13.8% |
| 154 ml | 4.5% |
| 155 ml | 11% |
The distribution law is in the form of a graph, now these are not discrete values, as in the table, this is an approximate representation of how much water is actually in a glass. If we want to find out what is the probability that there is 150 ml of water in a glass, we must calculate the probabilities of all values between 149.5 and 150.5, which is equal to the area of the graph between 149.5 and 150.5 (if you don't understand why - study integrals). It is logical that the area under a specific value will be infinitely small, therefore the probability of any specific event will be zero.
So, for discrete distributions we build tables, for the rest - graphs, the table placed on the left is not quite correct, because in reality we fill out a huge table with specific values, without rounding, and then build a graph, but without a doubt such a table can be used to understand the process.
Terms!
There may be some confusion in terms of:
Probability function - a function that has the input value X, and the output probability of the event X;
Distribution function - a function that has an input value of X, and an output probability of events less than or equal to X;
Probability density is a probability function.
How to make a distribution law
Now you know that in order to make a distribution law, it is necessary to collect data and arrange them in the form of a graph (or table, if we are talking we are talking about discrete quantities). The compilation of the distribution law is the result of the collection of statistical data, then this law is used for decision-making.
- Collect data
- Present data in numerical form
- Organize data
Distribution laws used
At the moment, there are a huge number of distribution laws, without a doubt, the Gauss distribution (normal distribution) is the most popular, because it describes any "normal" event, also, in production and the service sector is often used Poisson distribution, for example, in queue theory or as in the example about a telephone exchange.